
CFD Analysis of Aerodynamic Characteristics of a Pickup Truck
Simulating 30 m/s airflow to uncover pressure hotspots and optimize drag.
Skills Gained
Research Replication

OBJECTIVE
Perform a high-fidelity CFD study to
-
Simulate 30 m/s external airflow over a 1:12 pickup-truck model.
-
Replicate & validate pressure-coefficient curves and drag forces from the 2009 Clemson & GM R&D study.
-
Execute a mesh-independence analysis to lock in an optimal ~2.9 M-element mesh.
-
Compare “tailgate up” versus “tailgate down” to quantify their effects on bed-region turbulence and overall drag.
My Process


Body Of Influence
Geometry prep
To the mesher

To the solver after 5 'Not responding'
errors 🫠

-
A realizable k-epsilon turbulence model used to solve turbulence flows.

Optimum Mesh chosen
Results & discussion
Velocity Contour

-
Peak velocity above roof → streamlined flow downstream.
-
Recirculating bubble in truck bed → source of extra drag.
Red zones show flow acceleration over the cab; recirculation in the bed.
-
Front bumper pressure peak correlates with drag force.
-
Pressure drop over hood → lift considerations for vehicle stability.

Pressure Contour
High pressure at bumper & windscreen due to stagnation.
Validation

Cp curves mirror the 2009 Clemson & GM study’s trends, with minor offsets attributed to reference-pressure choices and coordinate origins
tailgate up or down?
Tailgate Down

More turbulence thus increasing resistance
Tailgate Up
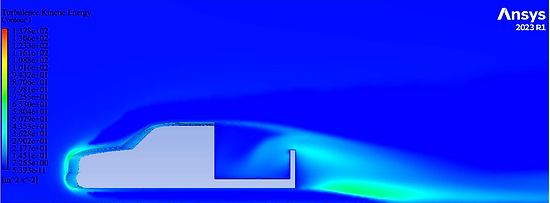
Less turbulence ; reduced resistance